Monitoring
Overview
- Receive and send logs with rsyslog
- Metrics
- node_exporter
- Prometheus
- Visualizations
- Grafana for Prometheus
- Centralized logging
- Loki
- Promtail
- Grafana for Loki
- Epilogue
Introduction
Monitoring is the process of collecting, analyzing, and displaying data about the performance, availability, and health of systems, applications, and network infrastructure. By continuously observing the state of these components, monitoring enables operators and administrators to gain insights into the behavior of their environment, detect potential issues, and proactively resolve problems before they impact users or critical business processes.
The need for monitoring arises from the increasing complexity and scale of modern IT environments, which require effective tools and techniques to ensure their reliability, performance, and security. Monitoring helps organizations maintain a high level of service quality, adhere to service level agreements (SLAs), and optimize resource usage, all of which contribute to better user experience and overall operational efficiency.
In practice, monitoring involves gathering various types of data, such as metrics, logs, and traces, from different sources and presenting them in a meaningful way. This data is then used to analyze trends, detect anomalies, generate alerts, and drive informed decision-making. Additionally, monitoring supports capacity planning, performance tuning, incident management, and root cause analysis efforts, which are essential for maintaining the availability and performance of IT services.
Rsyslog
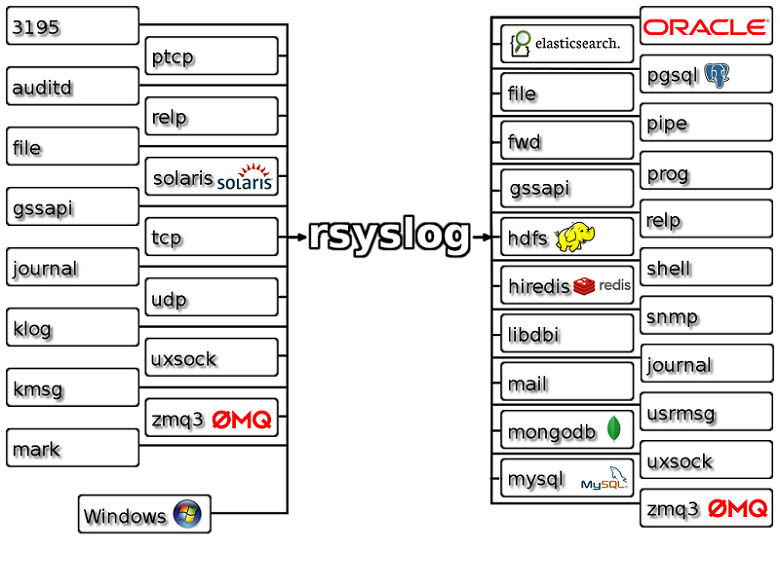
Most Linux distributions use a daemon called rsyslog for handling logs. It is capable of forwarding logs to remote servers, accepting logs from remote servers and handling logs locally, with relatively simple configuration. Rsyslog makes it possible to centralise log files for archival and storage fairly simply.
Rsyslog is the rocket-fest system for log processing. It offers high performance, security features and a modular design. Over the years, it evolved into a kind of swiss army knife of logging. Its ability to accept inputs from a broad range of sources, manipulate and transform them and send them to various destinations (see the feature map of rsyslog).
But as we talked in the lecture, it does fall short on more complicated use cases, that sadly nowadays world might need. Especially distributed storage and being able to handle microservices. But if you think you can get rid of this system, then sadly you're mistaken - some devices will probably use rsyslog for decades to come, things like network switches and routers, server integerated management consoles, etc.
In this rsyslog task, we will configure our VM machine to serve as log receiver (a machine ingesting the logs) and log transmitter (a machine that sends its logs to a centralised machine).
The default configuration of rsyslog on CentOS 9 doesn't use a socket or port to send logs; instead, it sends logs to journalctl, and rsyslog pulls these logs from there.
What we want to achieve, is to receive events from network, on port 514/tcp, and write them to a different file in our /var/log folder, so we can see what's happening. To simplify things, we write each received machine's logs to different folder in the /var/log.
Configure rsyslog to receive logs on a port
Your rsyslog will use port 514/tcp for network connectivity, so make sure to open it
The main configuration file of rsyslog is /etc/rsyslog.conf.
Back up the original configuration and edit the following parameters:
- Enable
module(load="imtcp") - Enable
input(type="imtcp" port="514") - Add parameter
name="remote"to the previous line - we will use this name later to match the received logs.
This allows your machine to accept incoming logs on port 514/tcp, and adds a name to the incoming logs.
...
module(load="imtcp")
input(type="imtcp" port="514" name="remote")
...
Now, configure a template for the incoming logs, otherwise all the log entries from the remore server mix with the hosts' local logs. Create a config file for receiving the logs at /etc/rsyslog.d/01-receiving.conf, and add the following content:
$template DynamicFile,"/var/log/%HOSTNAME%/forwarded-logs.log"

if $inputname == "remote" then {
    *.* -?DynamicFile
}
This template matches all logs with input name "remote", and writes them to /var/log/%SENDING_MACHINE_HOSTNAME%/forwarded-logs.log file.
Make sure to restart the rsyslog service, and check that rsyslog daemon has no errors.
Verify
For verification, you can use the logger command line utility to send a logline over the network to your machine. Check logger --help on how to provide the server name, port and protocol. If you do everything correctly, the log you wrote should appear in /var/log/<hostname>/forwarded-logs.log.
Also, the scoring server tries sending logs to your machine. These should go to /var/log/172.17.66.134/forwarded-logs.log. You should be able to read logs from this file.
With this very basic configuration, you already have a working log aggregation server. If this was your own environment, the only thing left to do, would be to send all your logs from other machines to this machine. You can easily do this with rsyslog as well - check the last few commented lines of /etc/rsyslog.conf.
Metrics
Metrics are numerical measurements that represent the behavior, performance, and health of systems, applications, and network infrastructure. They provide quantitative data that helps operators and administrators understand the current state of their environment and make data-driven decisions. By continuously collecting and analyzing metrics, sysadmins can identify trends, detect anomalies, and optimize their infrastructure to ensure a high level of service quality and performance.
A simple example of a metric is the amount of time it took for the web server to load the content of this page, or how much CPU the container running the webserver takes.
In practice, metrics are gathered from different sources, such as operating systems, hardware components, and application instrumentation. This data is collected at regular intervals and stored in time-series databases, which enable efficient querying, aggregation, and analysis of historical and real-time data. Metrics can be visualized in dashboards, charts, and graphs, providing a clear and concise view of the monitored systems' performance and health.
Our goal will be to setup a node_exporter, Prometheus and Grafana cluster, to provide monitoring for our own machine. We will be doing this by installing the components to our Kubernetes cluster - it just makes the setup process easier.
node_exporter
In this lab, we will be using a tool called Node Exporter to expose Linux host metrics. Node Exporter is a widely used, open-source monitoring tool that collects hardware and operating system metrics from Linux-based systems.
Developed as part of the Prometheus project, Node Exporter exposes these metrics in a format that can be easily scraped and ingested by a Prometheus server.
First, let us setup our Node Exporter. We will be using a resource type called DaemonSet, which is very similar to Deployment - the difference is in the fact, that while with Deployment, you can choose how many replicas will run, a DaemonSet will always run one replica on each node of the cluster. This is perfect for distributing monitoring tools across the cluster.
Setup node-exporter DaemonSet
This is the manifest you can use to setup the node-exporter DaemonSet, which should startup a single Pod.
We want to use the namespace named prometheus for deploying node_exporter. This task is left up to the reader.
apiVersion: apps/v1
kind: DaemonSet
metadata:
  name: node-exporter
  namespace: prometheus
spec:
  selector:
    matchLabels:
      app: node-exporter
  template:
    metadata:
      labels:
        app: node-exporter
    spec:
      containers:
      - name: node-exporter
        image: prom/node-exporter:latest
        args:
        - "--path.procfs=/host/proc"
        - "--path.sysfs=/host/sys"
        - "--path.rootfs=/host/root"
        - "--collector.filesystem.ignored-mount-points=^/(sys|proc|dev|host|etc)($$|/)"
        ports:
        - containerPort: 9100
          name: http-metrics
        volumeMounts:
        - name: proc
          mountPath: /host/proc
          readOnly: true
        - name: sys
          mountPath: /host/sys
          readOnly: true
        - name: root
          mountPath: /host/root
          readOnly: true
      volumes:
      - name: proc
        hostPath:
          path: /proc
      - name: sys
        hostPath:
          path: /sys
      - name: root
        hostPath:
          path: /
A few things to note from this manifest:
- It mounts several filesystems
/proc,/sysand even just/.- Even though it does so in read-only mode, this has serious security implications, if you do not trust the software.
- Sadly monitoring solutions need access to many places to be able to gather all the information needed.
- It exposes a
containerPort9100.
Verify the node-exporter containers
With the commands you learned in the previous lab, you should be able to see a node-exporter container starting up inside the prometheus namespace.
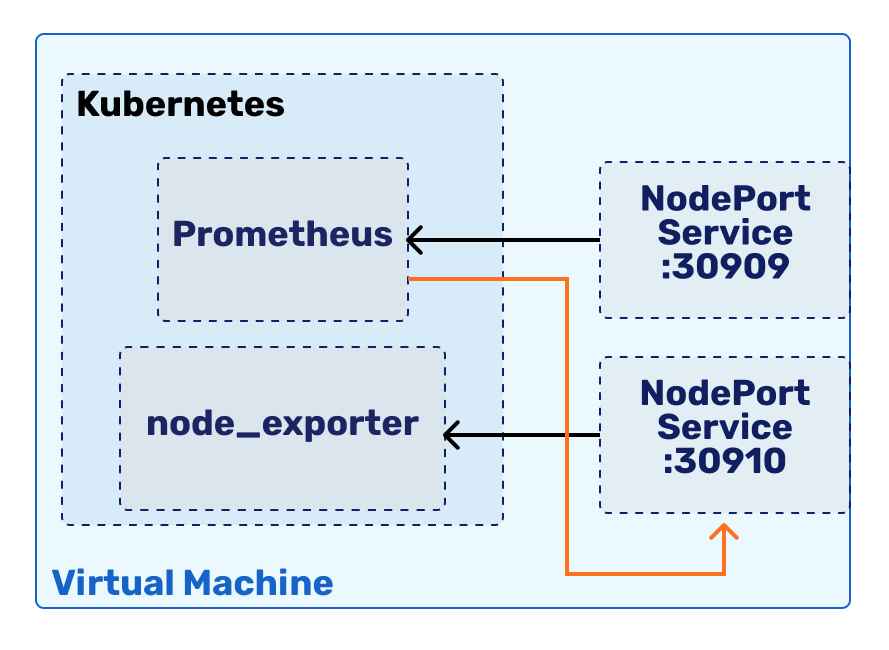
Even though we will run our node_exporter and Prometheus both inside Kubernetes, for debug and scoring reasons, we want to be able to access them from outside the machine as well. As we learned in the previous lab, this requires us to use a Service type NodePort resource inside Kubernetes. Let's dedicate our virtual machine port 30910 for node_exporter.
Expose the container on port 30910
Expose the container on port 30910, by making an appropriate Service. The template is the following:
apiVersion: v1
kind: Service
metadata:
  name: node-exporter
  namespace: prometheus
  labels:
    app: node-exporter
spec:
  selector:
    app: <appropriate app label from DaemonSet>
  ports:
  - name: http-metrics
    protocol: TCP
    port: <the port exposed by the container>
    targetPort: <the port exposed by the container>
    nodePort: <the port we want to expose on the host>
  type: <appropriate Service resource type>
Do not forget to also open this port up in the different firewalls we use.
Verify
You can test whether your deployment works by trying to curl the IP of your machine, port 30910. It should answer you with a redirection to /metrics, which, when queried, answers you with a long text file.
If everything worked out, the answer you get from the deployment should have thousands of lines in the following format:
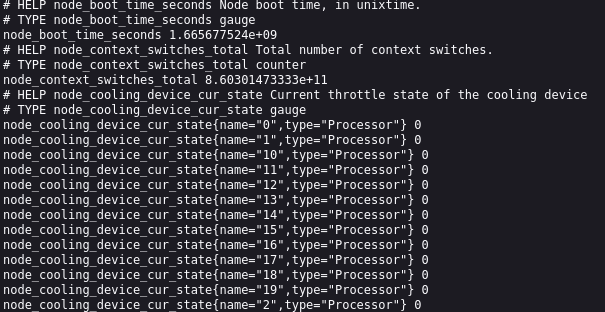
This is the OpenMetrics format, which Prometheus and it's exporters use for describing metrics. The format short description:
<metric name>{<label_key>=<label_value>} <metric_value>
The result is a list of metrics at the time of query. For example, it might be the response contains node_cpu_seconds_total metric with labels cpu="0" and mode="idle", with the metric value 2.19401742e+06.
This means, that since the start of the machine, CPU number 0 has idled for 2.19401742e+06 seconds. This number is taken by the exporter from the file /proc/stat on our virtual machines.
Prometheus
Now that we have an exporter in place, let's setup a system to query that exporter, and provide a way to store and aggregate this data.
Prometheus is an open-source monitoring and alerting toolkit designed for reliability and scalability, primarily used for monitoring containerized and distributed systems. Developed at SoundCloud and now a part of the Cloud Native Computing Foundation (CNCF), Prometheus has become a widely adopted monitoring solution in modern cloud-native environments. Its powerful query language, data model, and efficient storage design make it an ideal choice for organizations seeking to monitor their infrastructure, applications, and services.
Prometheus operates on a pull-based model, where it actively scrapes metrics from target systems or applications at regular intervals. This approach simplifies the overall architecture and makes it easier to scale and manage. We will be configuring our Prometheus to query our Node Exporter every 15 seconds.
Setup Prometheus
Setting up Prometheus is a bit more work, as we also want to give it a configuration file. We will be doing this with a ConfigMap resource, which gets mounted to the prometheus Pod in a place where Prometheus software expects it.
Also, we will be using a StatefulSet resource here, instead of a Deployment or DaemonSet. It provides a better way of running stateful applications, as Kubernetes is less likely to try to move them away, and gives the resources handled by StatefulSet better ordering and uniqueness guarantees.
---
apiVersion: v1
kind: ConfigMap
metadata:
  name: prometheus-config
  namespace: prometheus
data:
  prometheus.yml: |
    global:
      scrape_interval: 15s
      evaluation_interval: 15s

    scrape_configs:
      - job_name: 'kubernetes-node-exporter'
        static_configs:
          - targets: ["node-exporter.prometheus.svc:9100"]
---
apiVersion: apps/v1
kind: StatefulSet
metadata:
  name: prometheus
  namespace: prometheus
spec:
  serviceName: prometheus
  replicas: 1
  selector:
    matchLabels:
      app: prometheus
  template:
    metadata:
      labels:
        app: prometheus
    spec:
      containers:
      - name: prometheus
        image: prom/prometheus:latest
        args:
        - "--config.file=/etc/prometheus/prometheus.yml"
        - "--storage.tsdb.path=/data"
        ports:
        - containerPort: 9090
          name: http-metrics
        volumeMounts:
        - name: config
          mountPath: /etc/prometheus
        - name: data
          mountPath: /data
      volumes:
      - name: config
        configMap:
          name: prometheus-config
  volumeClaimTemplates:
  - metadata:
      name: data
    spec:
      accessModes:
      - ReadWriteOnce
      resources:
        requests:
          storage: 10Gi
---
Things to note here:
- We will be using
volumeClaimTemplates, which automatically generates a PVC for us. - The container exposes the port 9090.
- We create a
ConfigMapresource, which will get mounted to the Pod at the path/etc/prometheus. - Data will be kept by Prometheus on the persistent volume, mounted to
/datain the Pod.
Verify
We can verify whether everything works with the normal Kubernetes commands, making sure the Prometheus container comes up.
After we have a Prometheus instance running, we need to also expose it, similarly like we did with the node_exporter.
Expose Prometheus on VM port 30909
Dedicate the VM port 30909 for the Prometheus Service. You can use the same template as before, but make sure to fill-in and replace correct values.
Verify
You can verify that everything works by going to the exposed port. A web UI should start, that gives you access to a query console, and several other tabs.
You can make sure everything works properly by either:
- Going to
Statustab ->Targets. You should have one endpoint listed there, with the state UP. - Going to the
Graphtab, and inserting a PromQL queryup{}into the expression input - On pressing
EnterorExecute, you should receive a result.
The second option is what querying Prometheus looks like. By using their own query language called PromQL, you can query the different metrics.
If you want to play around with more complicated queries, here's a few examples: Awesome Prometheus
Visualisations
Having to query an arbitrary system has limited benefits, and is very annoying to use. It would be way better if we could use some kind of system humans have adapter better to, than numbers and formulas.
That's why most monitoring systems also come with a way to build visualisations, dashboards, graphs and diagrams. Humans are way better at seeing and correlating patterns in images, than in textual representation of numbers.
Grafana
Grafana is an open-source, feature-rich visualization and analytics platform used for monitoring and observability. It provides an intuitive and customizable interface for visualizing time-series data from various data sources, such as Prometheus, InfluxDB, Elasticsearch, and many more. Grafana's popularity stems from its flexibility, ease of use, and extensive plugin ecosystem. We will be using it as a visualisation frontend to Prometheus, and later, Loki.
Complete
Similarly to previous deployments, let us deploy Grafana. Let's deploy it in a different namespace called grafana. Also, expose this service on the VM port 30000.
apiVersion: apps/v1
kind: Deployment
metadata:
  name: grafana
  namespace: grafana
spec:
  replicas: 1
  selector:
    matchLabels:
      app: grafana
  template:
    metadata:
      labels:
        app: grafana
    spec:
      containers:
      - name: grafana
        image: grafana/grafana:latest
        env:
        - name: GF_SECURITY_ADMIN_USER
          value: "admin"
        - name: GF_SECURITY_ADMIN_PASSWORD
          value: "password"
        ports:
        - name: http
          containerPort: 3000
        readinessProbe:
          httpGet:
            path: /api/health
            port: http
          initialDelaySeconds: 30
          timeoutSeconds: 5
        volumeMounts:
        - name: grafana-storage
          mountPath: /var/lib/grafana
      volumes:
      - name: grafana-storage
        emptyDir: {}
As this version of Grafana is stateless, we can easily use Deployment to deploy it.
Also take note of the env part of the manifest - we configure some container environment variables there. Namely, the admin username and password are configured there.
This is not a secure method, but it works for our intents and purposes currently.
Verify
You can verify this service by going to the exposed port with your browser. You should be greeted with a graphical user interface, asking you to login. This is where the environment variables come into play, that we setup in the manifest. Use those to login.
Once you have logged into the system, you should have a fairly empty Grafana with no visualisations or dashboards. Let's fix this issue by importing a dashboard to view our metrics.
Add a Prometheus data source
In the left burger menu (three horizontal stripes), go to Connections -> Data Sources, and click on the + Add new data source button in the top left.
From the list of possible data sources, we now need to choose Prometheus, and click on it. In the new window, we need to only fill in the URL field, with either the cluster-internal DNS for the Prometheus, or machine name and port. The format for cluster-internal URL is http://<prometheus_service_name>.<prometheus_namespace>.svc:<service_port>.
In the bottom of the page, there's a Save & Test button. Upon clicking it, you should get a message that says everything succeeded.
Import a dashboard
In the left burger menu (three horizontal stripes), click on Dashboards. A new view is available, with a blue New button on the right. Click on New -> Import.
There should be a text input box asking for Grafana.com dashboard URL or ID. Insert the number 1860 there. This number corresponds to this dashboard from Grafana's page (check the lecture slides).
You can now click load. In the next screen, you need to fill in the Prometheus data source, and then you can click import.
After clicking import, you should have a nice screen with a lot of metrics visible to you. Feel free to look around. If something is broken, these metrics will be empty, in which case it's a good idea to ask TAs for help.
Centralized logging
Centralized logging is the practice of aggregating logs from multiple sources, such as applications, services, and infrastructure components, into a single, centralized location. This is similar to what we did with rsyslog, but we will use a newer technology for it, that is also capable of distributed deployments among other things. A logging solution deployed in a distributed fashion prevents from operators losing their visibility into the systems from a single failure in a monitoring solution.
Newer logging solutions also allow for ways to aggregate logs with other information from their systems, like metrics. This kind of centralized logging aggregated with other systems also simplifies the troubleshooting process by providing a single, unified view of log data, reducing the time spent searching for relevant information across disparate systems. We will be brushing past this very quickly, but if you want, you can play around inside the Grafana once we have both Prometheus and Loki connected with it.
Loki
Loki is an open-source, horizontally-scalable log aggregation system developed by Grafana Labs. Inspired by Prometheus, Loki is designed to be cost-effective, easy to operate, and efficient in handling large volumes of log data. It provides a simple yet powerful solution for centralizing logs from various sources, such as applications, services, and infrastructure components, making it easier to search, analyze, and visualize log data. Loki integrates seamlessly with the Grafana visualization platform, enabling users to explore logs alongside metrics for a comprehensive view of their systems.
The need for a tool like Loki arises from the challenges posed by modern, distributed environments, where logs are generated by numerous components running across multiple nodes. Traditional log management solutions can struggle to cope with the volume and complexity of log data produced by these systems, leading to increased operational overhead, storage costs, and difficulty in extracting meaningful insights. Loki addresses these challenges with a unique approach that indexes only the metadata of log data (e.g., labels and timestamps), rather than the log content itself. This results in a more efficient and cost-effective storage solution, while still providing fast and accurate log querying capabilities.
Even though Loki is designed to be simple to deploy and manage, it's not. It is simpler than other such distributed logging solutions, but it is definitely not simple. For simplicty sake, we will be deploying this application in a single-binary fashion - as a monolithic application. Here we take no benefit from it being a distributed logging solution. Sadly installing it in a distributed fashion would go way out of the scope of this course.
Our Loki deployment will look something like this:
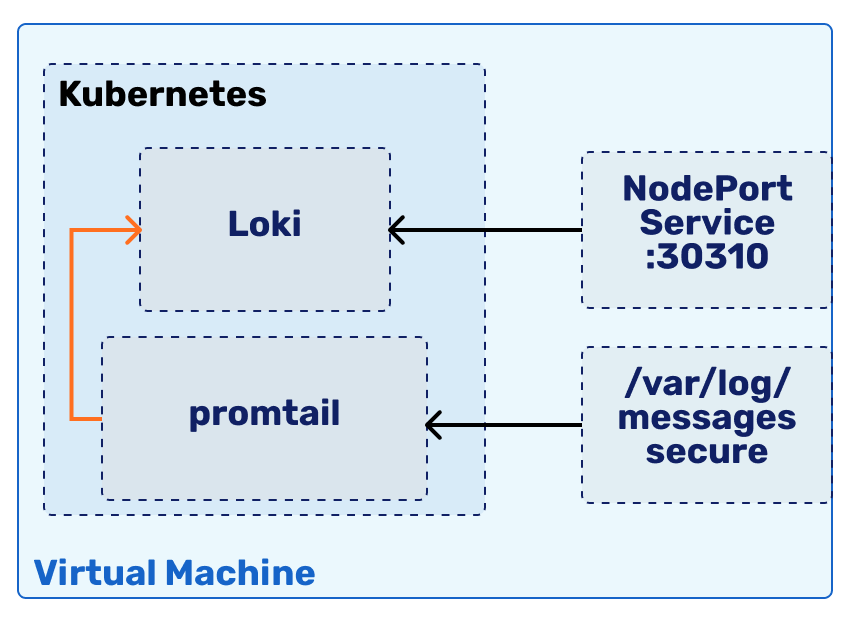
As logging systems usually follow the push methodology, where an agent pushes logs to the central system, then we need to start from setting up the central system.
Setup Loki
Let us deploy Loki in a new namespace called loki. We will also need to expose it via a Service - let us dedicate the host port 30310 for this.
apiVersion: v1
kind: ConfigMap
metadata:
  name: loki-config
  namespace: loki
data:
  loki.yaml: |
    auth_enabled: false

    server:
      http_listen_port: 3100

    ingester:
      lifecycler:
        address: 127.0.0.1
        ring:
          kvstore:
            store: inmemory
          replication_factor: 1
      chunk_idle_period: 15m
      chunk_retain_period: 5m
      wal:
        dir: /data/loki/wal

    schema_config:
      configs:
        - from: 2023-01-01
          schema: v11
          store: boltdb
          object_store: filesystem
          index:
            period: 24h
            prefix: sysadmin_


    storage_config:
      boltdb:
        directory: /data/loki/index
      filesystem:
        directory: /data/loki/chunks

    limits_config:
      reject_old_samples: true
      reject_old_samples_max_age: 168h
      allow_structured_metadata: false

    table_manager:
      retention_deletes_enabled: false
      retention_period: 0

---
apiVersion: apps/v1
kind: StatefulSet
metadata:
  name: loki
  namespace: loki
spec:
  serviceName: loki
  replicas: 1
  selector:
    matchLabels:
      app: loki
  template:
    metadata:
      labels:
        app: loki
    spec:
      initContainers:
      - name: init-chown-data
        image: busybox:1.33.1
        command: ["sh", "-c", "chown -R 10001:10001 /data/loki"]
        volumeMounts:
        - name: data
          mountPath: /data/loki
      containers:
      - name: loki
        image: grafana/loki:latest
        args:
        - "-config.file=/etc/loki/loki.yaml"
        ports:
        - containerPort: 3100
          name: http-metrics
        volumeMounts:
        - name: config
          mountPath: /etc/loki
        - name: data
          mountPath: /data/loki
      volumes:
      - name: config
        configMap:
          name: loki-config
  volumeClaimTemplates:
  - metadata:
      name: data
    spec:
      accessModes:
      - ReadWriteOnce
      resources:
        requests:
          storage: 10Gi
Noteworthy part in the deployment is an initContainers part. This is a container that gets run before the main (loki) container. It's job is to make sure that the permissions on the persistent volume are in place before the loki container starts.
Init containers are great for setting up the internal Pod environment for the main containers to start.
Verify
You can verify whether Loki started up by querying it over the exposed port with curl, by doing curl <hostname>:<port>/ready. By Loki API specification, it should answer it with ready in a bit of time.
Make sure to give it a minute or two the first time it starts up - it needs time to initialise its internal processes.
Once we have the central system in place, we can continue with installing the log exporter called promtail.
Promtail
Promtail is an open-source log collection agent developed by Grafana Labs, specifically designed to integrate with the Loki log aggregation system. As a crucial component of the Loki ecosystem, Promtail is responsible for gathering log data from various sources, such as files, systemd/journald, or syslog, and forwarding it to a Loki instance. We will be keeping it simple, and just forwarding some log files from our /var/log directory to Loki, with promtail. Let's setup the Promtail to do that.
Setup Promtail
The last deployment we will do is called promtail. Because this tool pushes logs to Loki, we do not need to expose any kind of ports for it to work.
apiVersion: v1
kind: ConfigMap
metadata:
  name: promtail-config
  namespace: loki
data:
  promtail.yaml: |
    server:
      http_listen_port: 3101

    positions:
      filename: "/tmp/positions.yaml"

    clients:
    - url: http://loki.loki.svc.cluster.local:3100/loki/api/v1/push

    scrape_configs:
    - job_name: system
      pipeline_stages:
      - docker: {}
      - labels:
          source: "{{ .CommonLabels.source }}"
      - output:
          source: "{{ .Source }}"
      static_configs:
      - targets:
          - localhost
        labels:
          job: varlogs
          __path__: "/var/log/{messages,maillog,secure,httpd/*.log}"
---
apiVersion: apps/v1
kind: DaemonSet
metadata:
  name: promtail
  namespace: loki
spec:
  selector:
    matchLabels:
      name: promtail
  template:
    metadata:
      labels:
        name: promtail
    spec:
      containers:
      - name: promtail
        image: grafana/promtail:latest
        args:
        - "-config.file=/etc/promtail/promtail.yaml"
        volumeMounts:
        - name: config
          mountPath: /etc/promtail
        - name: varlog
          mountPath: /var/log
        - name: varlibdockercontainers
          mountPath: /var/lib/docker/containers
          readOnly: true
      volumes:
      - name: config
        configMap:
          name: promtail-config
      - name: varlog
        hostPath:
          path: /var/log
      - name: varlibdockercontainers
        hostPath:
          path: /var/log/containers
Few things to note:
- We use the cluster-internal DNS to connect
promtailwithloki, by using the addressloki.loki.svc.cluster.local, which is in the format of<service>.<namespace>.svc.cluster.local. - In the
ConfigMapwe configurepromtailto look at the following logs:/var/log/messages/var/log/maillog/var/log/secure/var/log/httpd/*.log
Verify
You can verify it works by checking the pod logs, checking it's up, and checking whether scoring turns green.
There's another way, where you can query the Loki HTTP API for the logs, but this is left as an optional task to the reader. We will be checking the logs from Grafana in a moment, anyways.
Grafana
As the last thing, let's also make these logs visible in the Grafana, by adding Loki as a data source and importing a new dashboard.
Add a Loki data source
In the left burger menu (three horizontal stripes), go to Connections -> Data Sources, and click on the + Add new data source button in the top left. From the list of possible data sources, we now need to choose Loki, and click on it.
From the list of possible data sources, we now need to choose Loki, and click on it. In the new window, we need to only fill in the URL field, with either the cluster-internal DNS and port for the Loki, or machine name and port. The format for cluster-internal URL is http://<loki_service_name>.<loki_namespace>.svc:<service_port>.
In the bottom of the page, there's a Save & Test button. Upon clicking it, you should get a message that says everything succeeded.
Add a Loki dashboard
In the left burger menu (three horizontal stripes), click on Dashboards. A new view is available, with a blue New button on the right. Click on New -> Import.
There should be a text input box asking for Grafana.com dashboard URL or ID. Insert the number 13639 there. This number corresponds to this dashboard from Grafana's page (check the lecture slides).
You can now click load. In the next screen, you need to fill in the Loki data source, and then you can click import.
After clicking import, you should have a screen with logs available to you, all aggregated from different sources. If something is broken, you won't see any logs, in which case it's a good idea to ask TAs for help.
You are now free to play around with your newfound monitoring capability.
Epilogue
This concludes our monitoring lab and the whole course. The next step is now to make sure that everything is green in the nagios monitoring, fill in the feedback form, and let a TA know that you have completed your labs, after which you'll be allowed to the exam.
Thank you for participating in the course, we hope you had fun and found the course useful.